
Timeline
The Timeline controls are divided into four main categories, identified with different background colours:
| gray | Playhead | |
| blue | Interval | |
| yellow | Events | |
| green | Active Clock (see how to enable this in the Events section under the heading Active Clock) |
You can zoom in and out of the Timeline using the scroll wheel on your mouse. Right-clicking on Timeline shows a short-cut menu for some relevant actions.
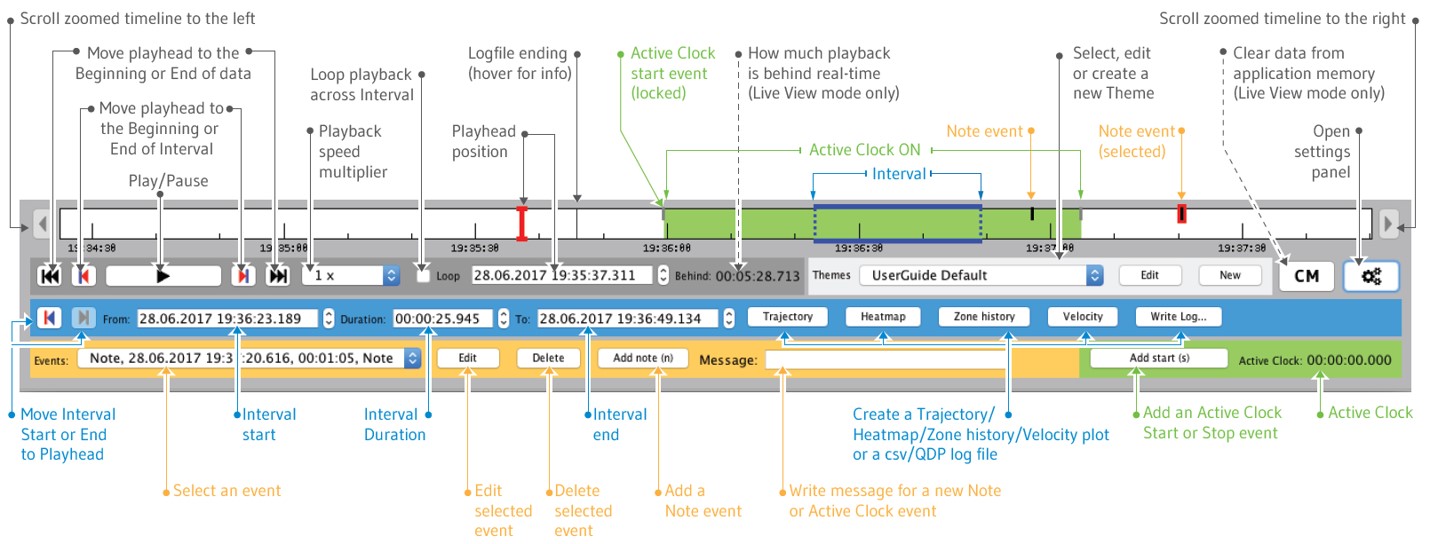
Playhead
The Playhead indicates your current position on the Timeline. The Playhead can be moved along the Timeline by dragging or by inputting the time value.Tip: The Play/Pause can be controlled with shortcut key
P.
Interval
The Interval is a part of the Timeline. It defines the time range for creating:- Trajectory
- Velocity
- Heatmap
- Heart rate
- Zone history
- Logfiles
The Interval also defines the area for Loop playback.
The Interval start and end points can be moved along the Timeline by dragging or by inputting the time value. The selected interval can be moved along the Timeline by dragging.
Tip: If you want to generate plots of Log files, or loop the playback
across the whole data, simply strech the Interval across the whole
Timeline.